Remote Telemetry System
End-to-end cloud monitoring system collecting real-time motor state, position, and torque data from Ceily/Wally devices via MQTT→AWS IoT→InfluxDB→Grafana pipeline
Context
- System: ESP32-S3 based robotic devices (Ceily ceiling robot, Wally wall robot)
- Scope: Full-stack telemetry — firmware data collection, cloud ingestion, time-series storage, real-time dashboard
- Solo project: Designed and implemented the entire pipeline end-to-end
Core Problem
Devices installed at customer sites had no remote visibility:
- When customers reported issues, there was no way to diagnose remotely
- Installation support required on-site visits for every problem
- Torque anomalies (e.g., furniture friction) went undetected until motor damage occurred
What was needed: A system that streams device telemetry in real-time so engineers can monitor, diagnose, and support installations remotely.
Key Insight
Structure telemetry into multiple MQTT topics with different sampling rates and retention policies. Motion data needs high-frequency sampling (0.5s) but short retention (7 days), while system health needs low-frequency (30s) but long retention (1 year). Batch samples on-device before publishing to reduce MQTT overhead.
Approach
1) Architecture
ESP32-S3 (TLS 8883)
    │
    ▼
AWS IoT Core ──── IoT Rule
    │
    ▼
Lambda (influxdb-writer)
    │
    ▼
InfluxDB (Docker, EC2)
    │
    ▼
Grafana Dashboard
The device publishes over MQTT with TLS mutual authentication. AWS IoT Rules route messages to a Lambda function that converts JSON to InfluxDB Line Protocol and writes to the appropriate bucket.
2) Telemetry Topic Design
| Topic | Sampling | Batch | Retention | Data |
|---|---|---|---|---|
devices/{id}/motion | 0.5s | 10 samples / 5s | 7 days | Position, velocity, torque, model params |
devices/{id}/status | 5s | 1 sample | 30 days | Heap, CPU temp, servo state, ToF sensors |
devices/{id}/system | 30s | 1 sample | 1 year | Firmware version, uptime, boot count |
devices/{id}/events | On event | 1 | 90 days | State changes, errors, alerts |
Why separate topics? Each data type has different write frequency, query patterns, and storage cost. InfluxDB retention policies can only be applied per-bucket, so topic separation maps directly to bucket separation.
3) On-Device Data Collection
Motion telemetry is sampled every 0.5 seconds and batched into groups of 10 before publishing:
typedef struct {
    uint64_t timestamp_ms;
    uint8_t  state;           // Motion state enum
    int16_t  position_mm;     // Position in millimeters
    uint8_t  position_pct;    // 0-100%
    int16_t  velocity_x10;    // velocity × 10 (fixed-point)
    int16_t  torque_mnm;      // Torque in milli-Nm
    int16_t  remain_distance; // Remaining distance
    int16_t  command_vel;     // Current command velocity
    uint8_t  speed_control;   // Speed control state
    // Torque model parameters
    uint8_t  torque_index;
    float    theta[4];        // Model coefficients
    float    p[4];            // Prediction parameters
    int16_t  predicted_total; // Predicted torque (mNm)
    int16_t  threshold;       // Applied sensitivity
    bool     is_learning;
} motion_sample_t;            // ~56 bytes per sample
Batching 10 samples into one MQTT publish reduces connection overhead while keeping latency under 5 seconds.
The struct includes online learning parameters for the torque prediction model. The device runs a recursive estimator that fits theta[4] coefficients to predict expected torque from position and velocity. p[4] tracks estimator covariance (uncertainty). During initial operation, is_learning is true and theta values update rapidly. As the model converges, p values decay toward zero and predictions stabilize. The telemetry streams these parameters so engineers can verify convergence on the Grafana Learning panel — if theta keeps drifting or p doesn’t decay, the model hasn’t stabilized and the device needs recalibration.
4) Cloud Ingestion (Lambda)
The Lambda function supports two protocol versions and routes to appropriate InfluxDB buckets:
def lambda_handler(event, context):
    message = event if isinstance(event, dict) else json.loads(event)
    ver = message.get('ver', 1)

    if ver >= 2:
        lines, bucket = parse_protocol_v2(message)
    else:
        lines, bucket = parse_protocol_v1(message)

    return write_to_influxdb(lines, bucket)
Each parser converts JSON samples to InfluxDB Line Protocol with proper tags (serial_number, device_type) and nanosecond timestamps. Protocol v2 adds hardware version tagging and array-based servo/sensor flattening.
5) Grafana Dashboard
The dashboard provides four monitoring layers:
| Row | Panels | Purpose |
|---|---|---|
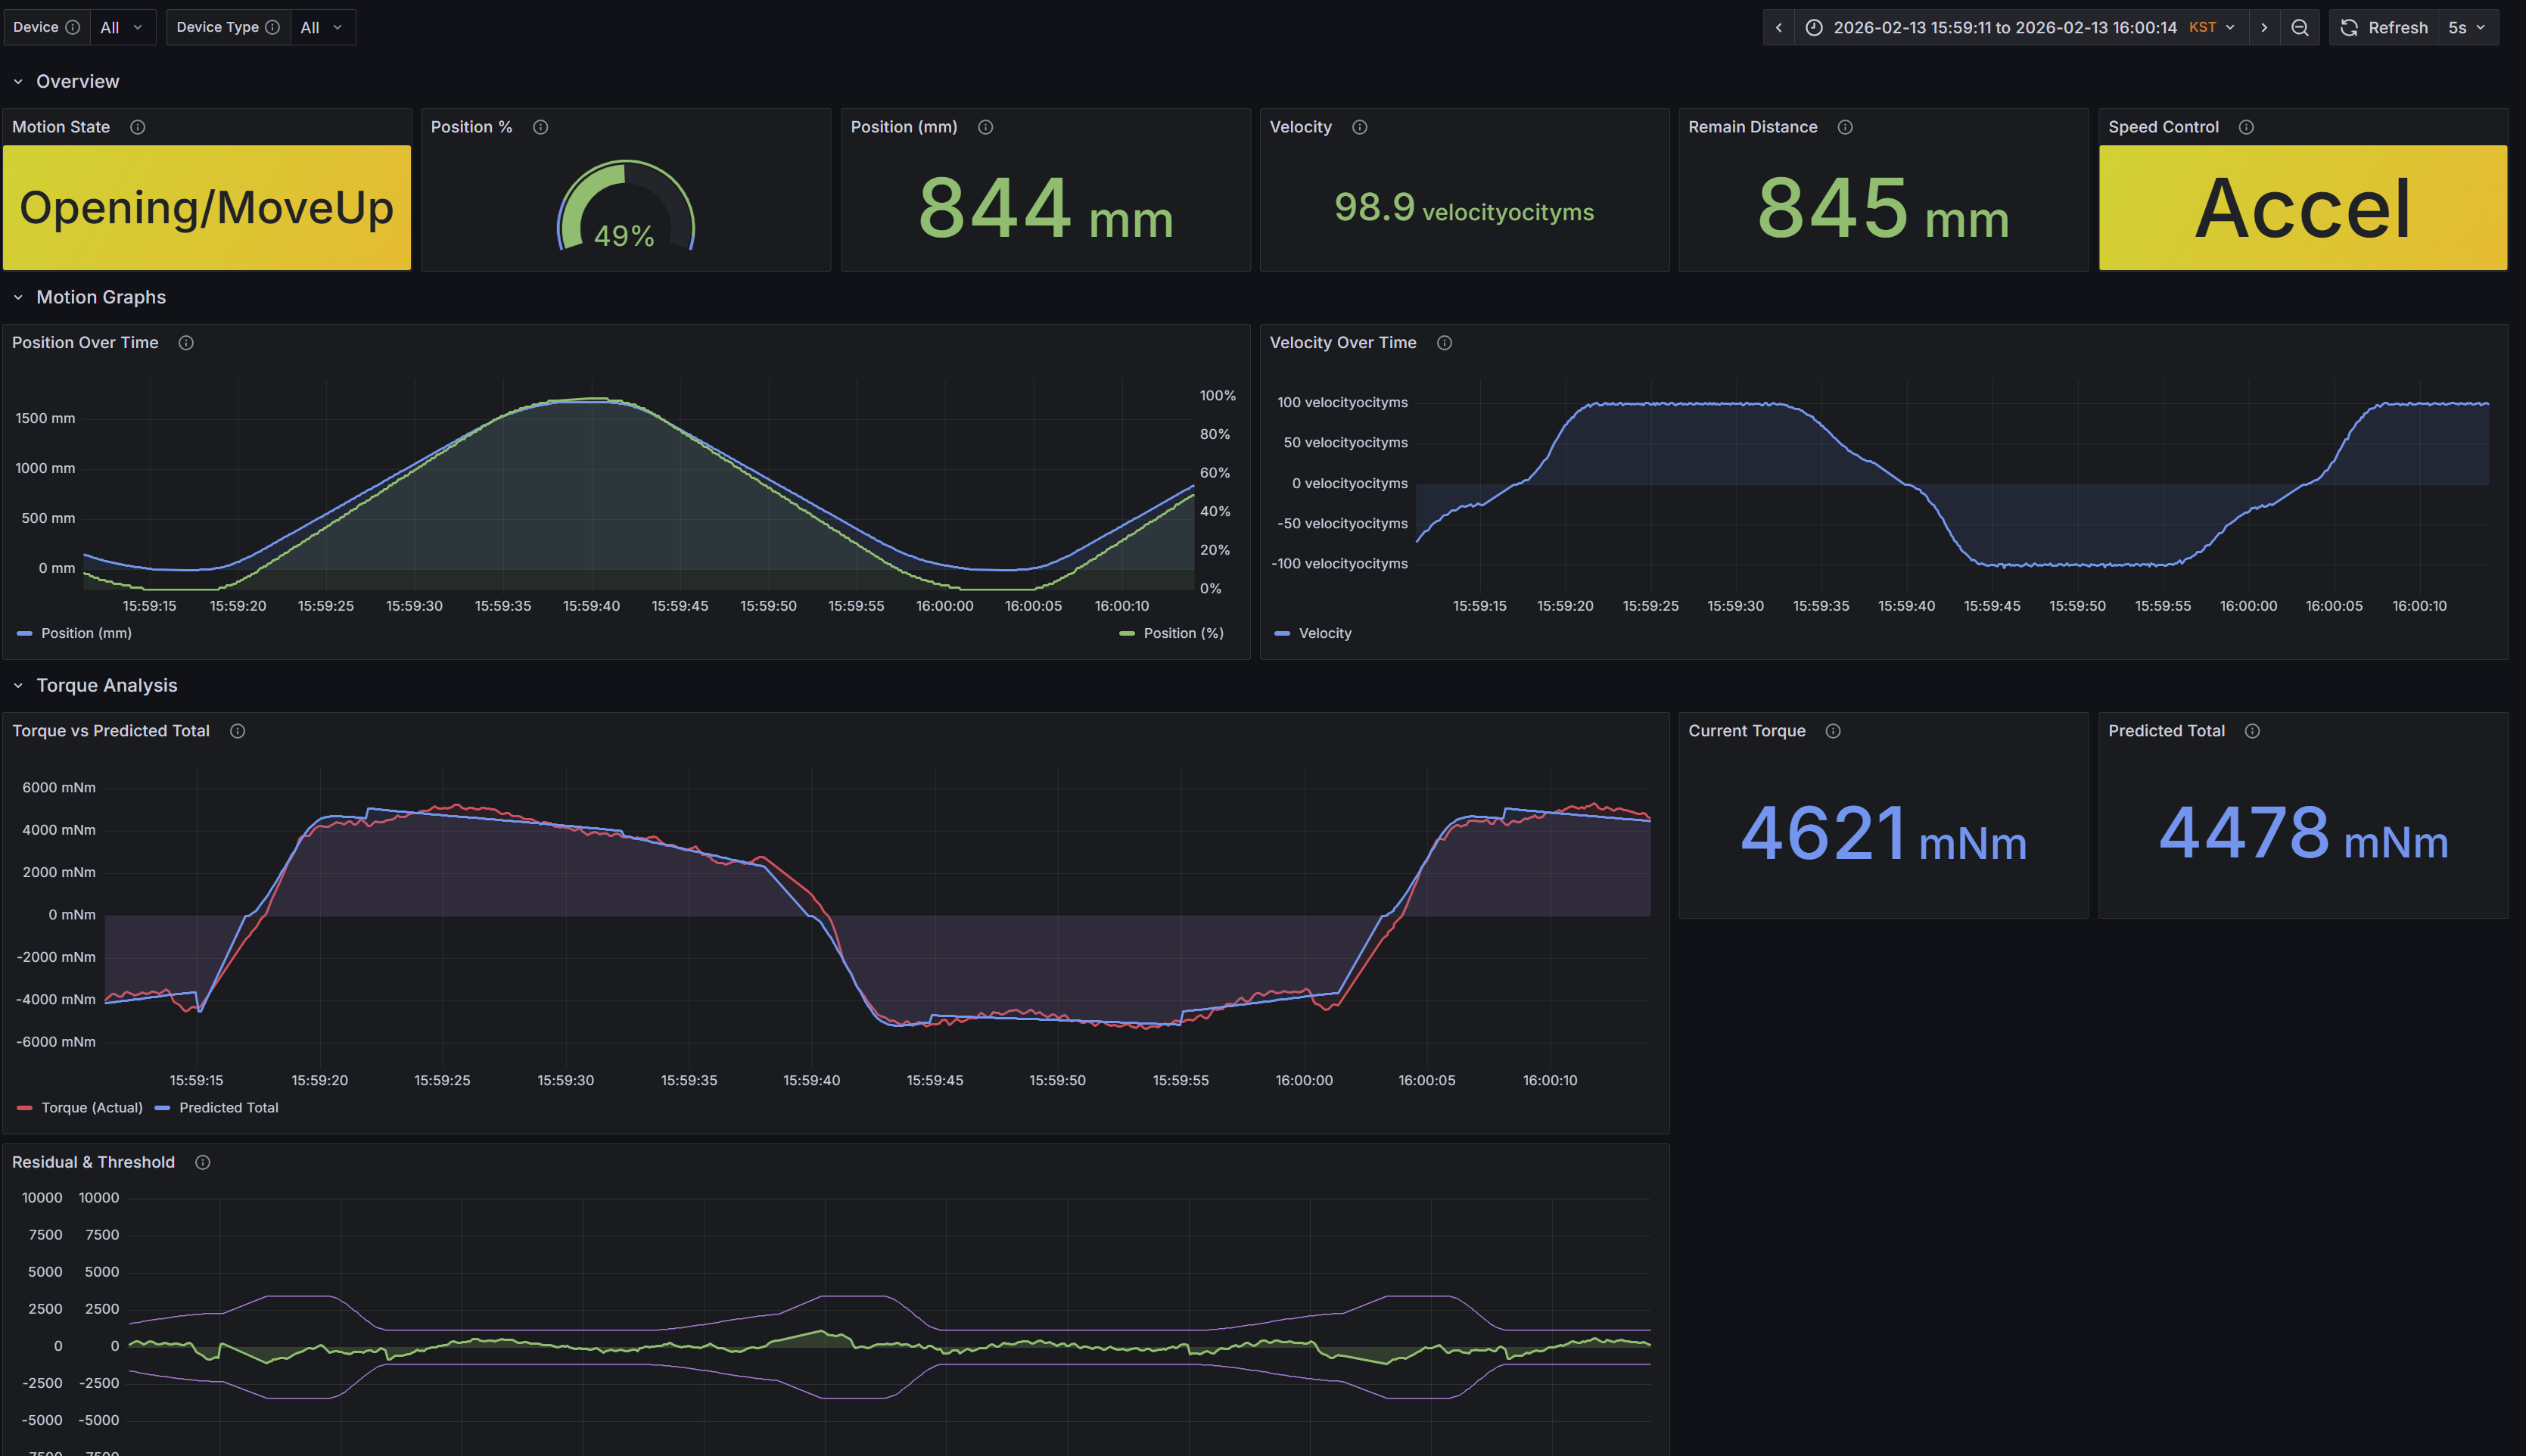
| Overview | Motion State, Position %, Position mm, Velocity, Remain Distance, Speed Control | At-a-glance device status |
| Motion Graphs | Position Over Time, Velocity Over Time | Motion profile analysis |
| Torque Analysis | Torque vs Predicted (with warning/critical thresholds), Current Torque, Deviation | Anomaly detection |
| Learning | Theta parameters, P parameters, Learning status | Torque model convergence |
Torque analysis panels overlay actual torque against predicted values with configurable thresholds (warning: 15 Nm, critical: 20 Nm), enabling immediate visual detection of mechanical anomalies.
Tradeoffs
| Decision | Rationale | Tradeoff |
|---|---|---|
| MQTT over HTTP | Persistent connection, lower overhead for frequent small messages | Requires connection management on ESP32 |
| InfluxDB over DynamoDB | Purpose-built for time-series queries, native Grafana integration | Self-managed EC2 instance instead of serverless |
| Lambda for ingestion | Serverless scaling, no server to manage for ingestion layer | Cold start latency (acceptable for monitoring) |
| 0.5s motion sampling | Captures full motion profile for torque analysis | ~56 bytes × 2/sec = ~10 KB/min per device |
| Batch publish (10 samples) | Reduces MQTT publishes by 10× | Up to 5s delay before data appears |
Results
Remote Diagnostics
- Identified furniture-floor friction on a customer device: the Torque Analysis panel showed actual torque exceeding predicted torque by >5 Nm during specific position ranges, which matched the furniture location on the travel path. The pattern was consistent across multiple motion cycles, confirming mechanical obstruction rather than a transient spike
- Resolved issue without on-site visit — previously would have required engineer dispatch
Operational Coverage
- 10+ devices monitored in production, scaling as deployment grows
- 4 telemetry channels with differentiated retention (7 days to 1 year)
System Performance
- Motion telemetry: 2 samples/sec per device with 5s batch latency
- Device status: continuous monitoring of CPU, memory, servo health, sensor state
- Torque model: online learning parameters visible in real-time for model convergence verification
Pipeline Validation
- End-to-end latency verified by comparing device-side
timestamp_mswith InfluxDB write timestamps — confirmed <6s from sampling to dashboard display - Data integrity checked by matching device-side sample counts against InfluxDB point counts over 24-hour windows; no data loss observed under normal MQTT connectivity
Key Takeaway
The critical design choice was topic-level separation by data characteristics rather than a single telemetry stream. This directly maps to InfluxDB retention policies and Grafana query patterns, making the system both cost-efficient (short retention for high-frequency data) and operationally useful (long retention for system health trends). The torque monitoring capability — comparing actual vs predicted torque in real-time — turned out to be the highest-value feature, catching mechanical issues that would otherwise require physical inspection.